HDBaseT Tab
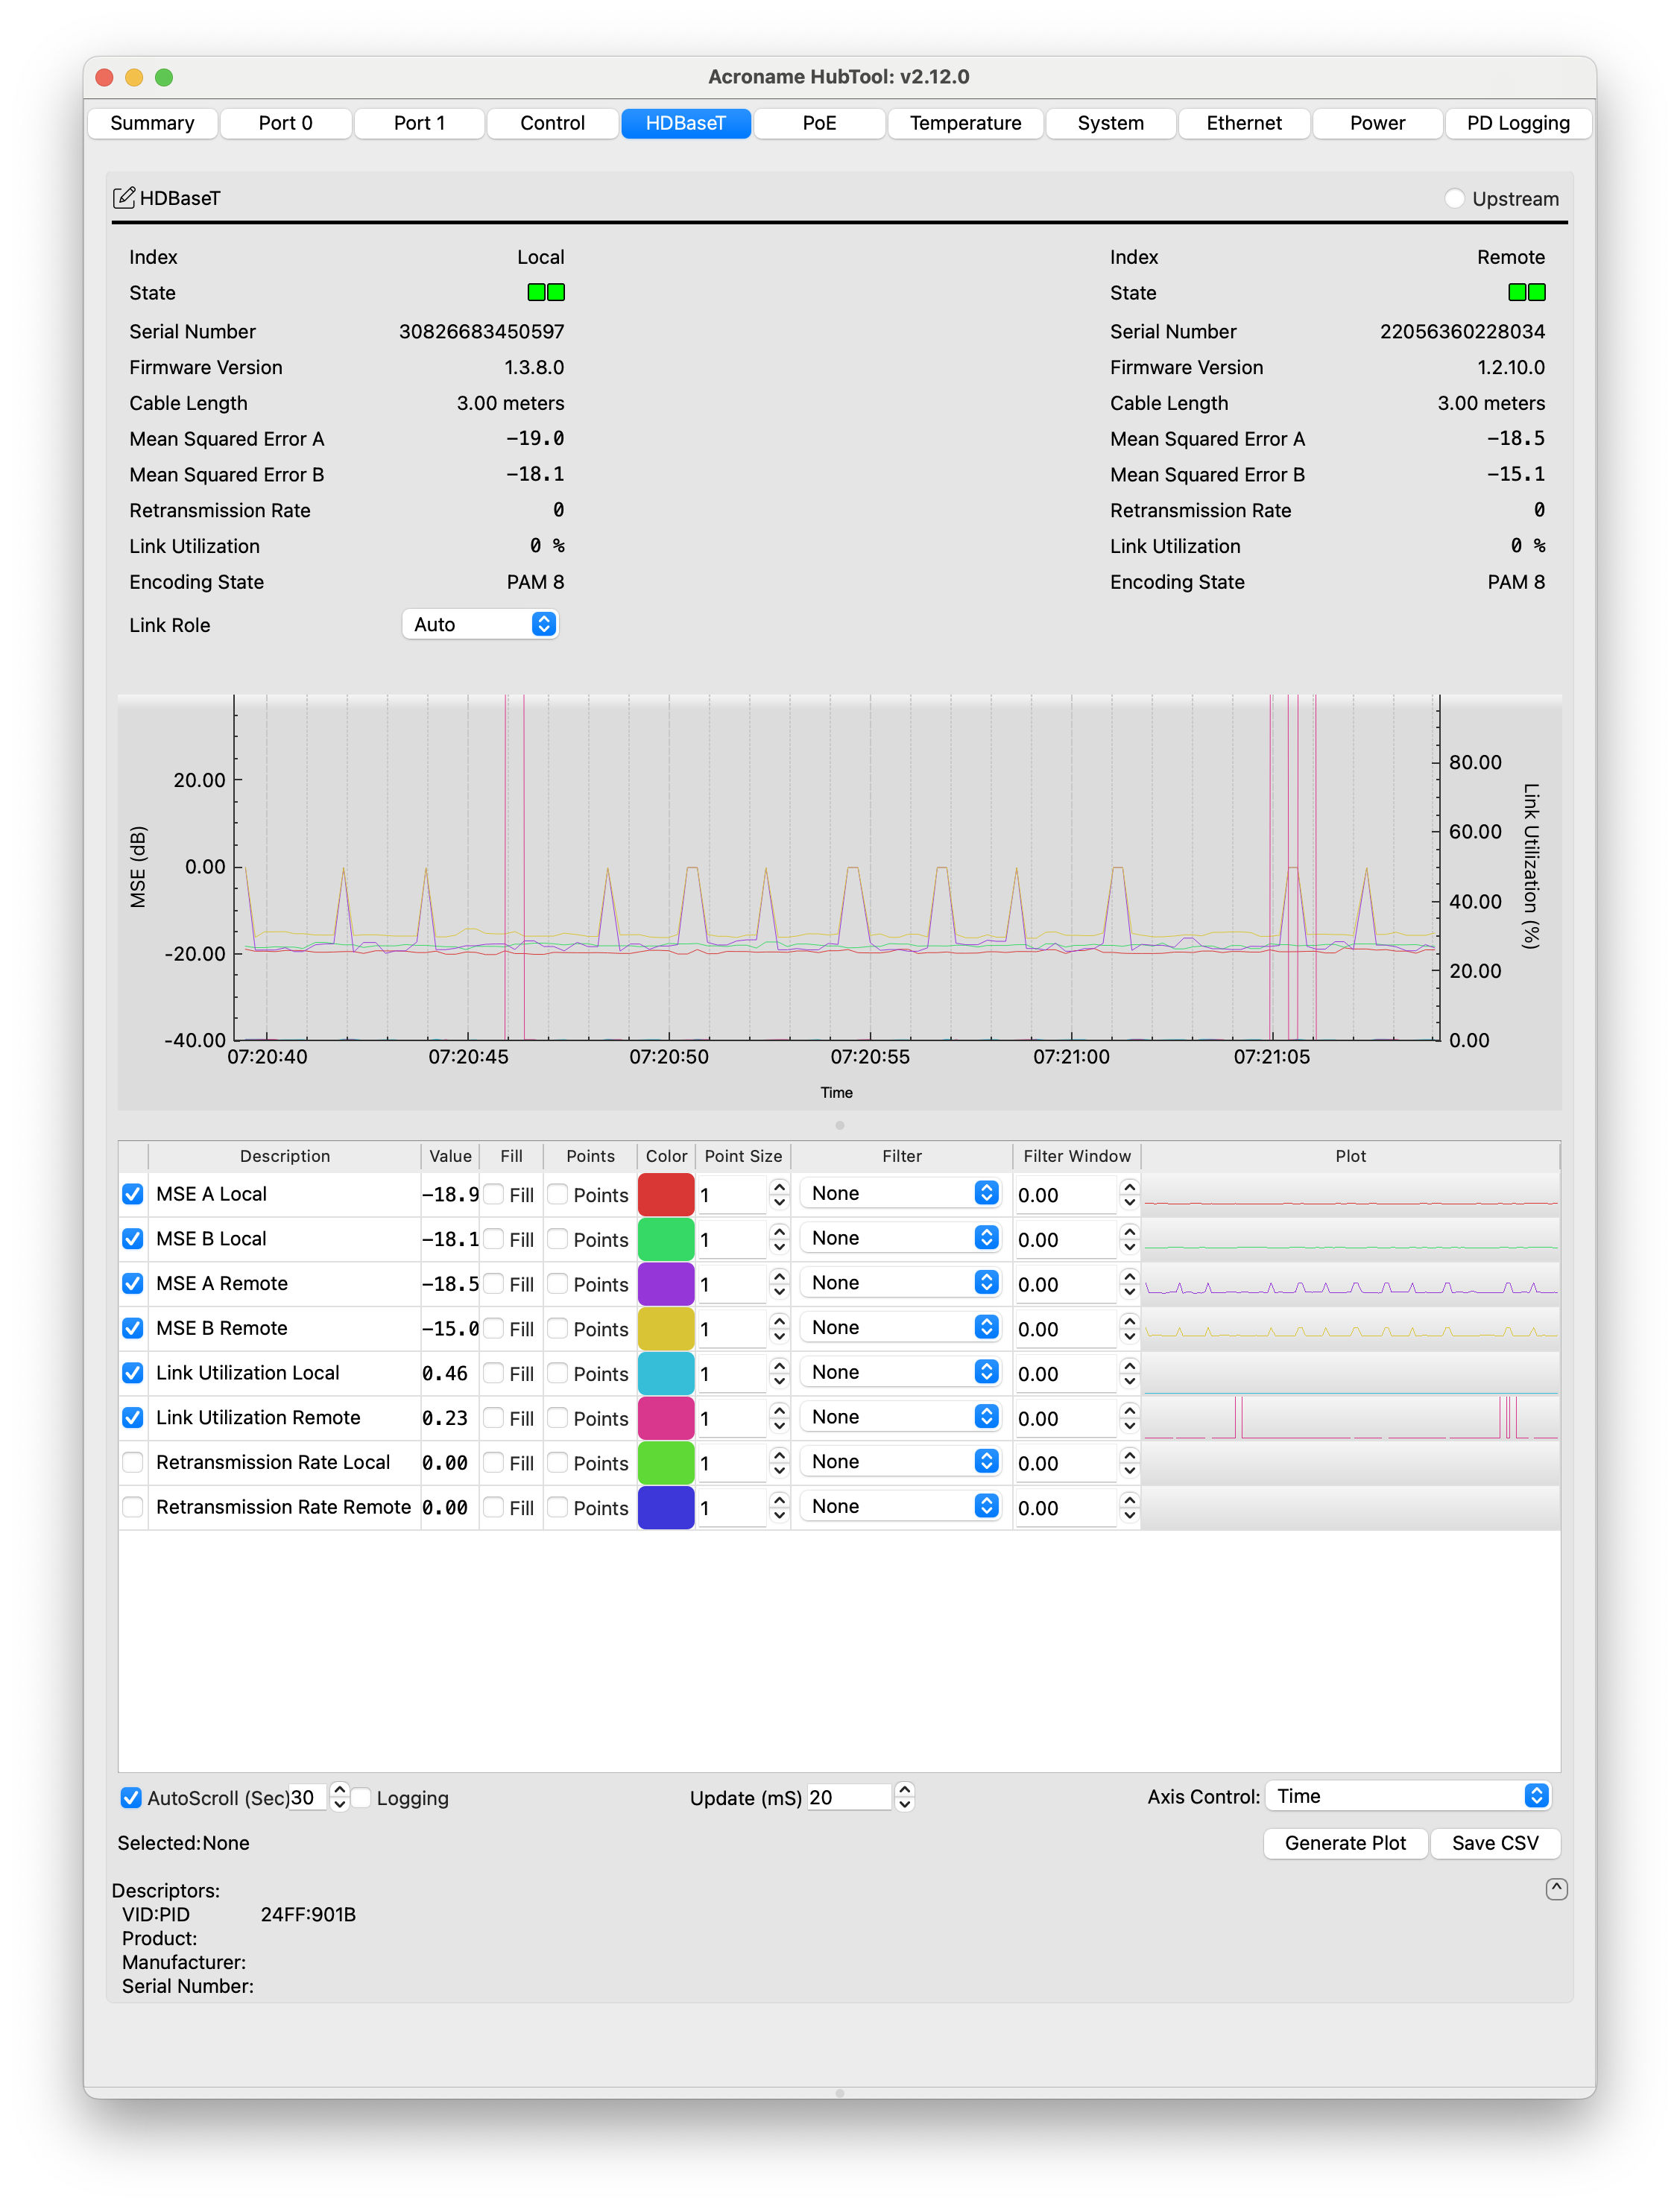
The HDBaseT tab shows the status of the HDBaseT-USB3 connection. The top panel shows data from the local extender on the left and the remote extender on the right.
Index (local or remote)
State (Device present, Link role and status)
Serial Number (of the VS6320)
VS6320 Firmware Version
Cable Length (m)
Mean Squared Error A/B (μdB)
Retransmission rate (# messages between retransmission, 0 = no errors)
Link Utilization (μ%)
Encoding state (e.g. PAM 8)
Link role (Auto, Leader, Follower)
Below that is a strip chart that can plot:
Mean square error (A or B, local, or remote)
Link Utilization % (local or remote)
Retransmisison rate (local or remote)
Autoscroll - toggles scrolling and the time value (sec) sets the visible buffer size.
Logging - enables storing data beyond the autoscroll duration.
Update - sets the plot update time in mS. Low values make the plot scroll more smoothly.
Axis Control - selects the axis to zoom when scrolling with the mouse wheel (Time, Mean squared error, Link utilizatiion, or Transmission rate)
Generate Plot - opens a new plot window
Save CSV -saves the current buffer to one CSV per channel selected